Warning in readLines(file): incomplete final line found on '.env'Warning in readLines(file): incomplete final line found on '.env'
An Application Programming Interface (API) is a set of functions for programmatically accessing and/or processing data. Packages like library(dplyr) and library(ggplot2) have APIs that were carefully designed to be approachable. The dplyr website says, “dplyr is a part of the tidyverse, an ecosystem of packages designed with common APIs and a shared philosophy.”
A web API is a way to interact with web-based software through code - usually to retrieve data or use a tool. We will only focus on web APIs in this tutorial. To use web APIs, actions between computers and web applications are typically communicated through URLs that are passed between the computers. Manipulating URLs is key to using web APIs.
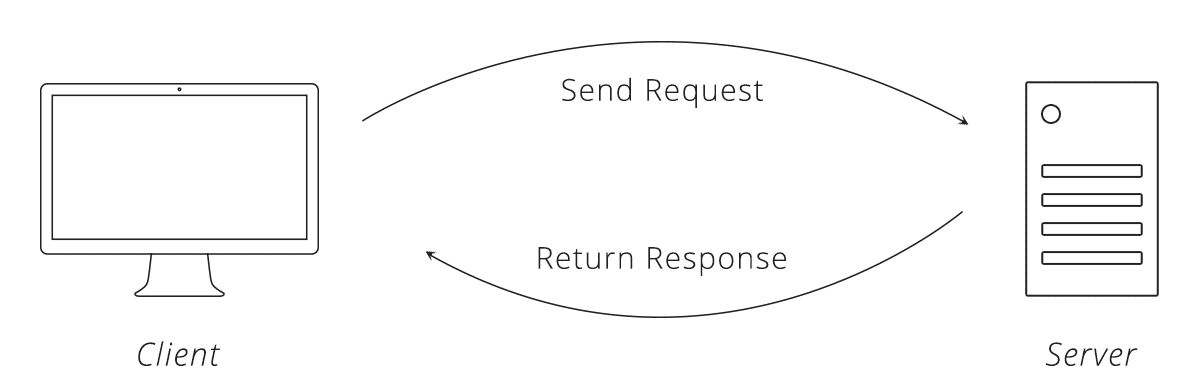
Source: Zapier
Uniform Resource Locator (URL): Text string that specifies a web location, a method for retrieving information from that web location, and additional parameters. We use these every day!
Let’s walk through an example from the Census Bureau.
? and includes three parameters: get, DATE_, and for. Note: The Census API now requires a key for data requests like this one. Append &key=<your key> to the end of the URL. See Authentication below for how to get a key.https://api.census.gov/data/2014/pep/natstprc?get=STNAME,POP&DATE_=7&for=state:57&key=<your key>Note: this call requests information for FIPS code 57, which does not exist.
APIs need to return complicated hierarchical data as text. To do this, most APIs use JavaScript Object Notation (JSON).
JSON is a plain text hierarchical data structure. JSON is not JavaScript code. Instead, it’s a non-rectangular method for storing data that can be accessed by most web applications and programming languages. Lists are made with []. Objects are made with {} and contain key-value pairs. JSON is good at representing non-rectangular data and is standard on the web.
Some example JSON could be:
{
  "Class name": "Intro to Data Science",
  "Class ID": "PPOL 670",
  "Instructors": ["Aaron R. Williams", "Alex C. Engler"],
  "Location": {
    "Building": "Healy Hall",
    "Room": "105"
  }
}
Web APIs can also return Extensible Markup Language (XML) and HyperText Markup Language (HTML), but JSON is definitely most popular. We’ll use library(jsonlite) to parse hierarchical data and turn it into tidy data.
?. The general form is key=value.&.The Census API requires a user-specific API key for all API calls. (You can sign up here) This API key is simply passed as part of the query string in the HTTP request.
It is a bad idea to share API credentials. NEVER post a credential on GitHub. A convenient solution is to use a credentials file with the library(dotenv) package as follows:
First, install the package using install.packages("dotenv") in the console and create a file called .env in the directory where your .Rproj is located. You may get a message that files starting with a “.” are reserved for the system; you should hit “ok” to proceed. You can store as many credentials as you want in this file, with each key-value pair on a new line. Note you need to hit enter after the last key-value pair so the file ends with a blank new line.
census_api_key=<key value>
Then, you can load your credential at the start of your R session:
Warning in readLines(file): incomplete final line found on '.env'Warning in readLines(file): incomplete final line found on '.env'Be sure to add this .env credentials file to your .gitignore: open .gitignore in your project folder and add .env on its own line!
Let’s walk through the example above using R. First install library(httr) and library(jsonlite) with install.packages(c("httr", "jsonlite")).
httr contains tools for working with HTTP and URLs. It contains functions for all HTTP methods including GET() and POST().
Using the final URL from the above example, let’s query state names and state population in July 2014 for all states, Washington, D.C., and Puerto Rico. Note, it is good practice to create the link outside of GET() because we may need to manipulate the URL string in later examples. Note that * is a wildcard character which requests data for all possible values of the parameter.
# get the contents of the response as a text string
pop_json <- content(pop_json, as = "text")

# create a character matrix from the JSON
pop_matrix <- fromJSON(pop_json)

# turn the body of the character matrix into a tibble
pop_data <- as_tibble(pop_matrix[2:nrow(pop_matrix), ],
                      .name_repair = "minimal")

# add variable names to the tibble
names(pop_data) <- pop_matrix[1, ]

pop_data
# A tibble: 52 × 4
STNAME POP DATE_ state
<chr> <chr> <chr> <chr>
1 Alabama 4849377 7 01
2 Alaska 736732 7 02
3 Arizona 6731484 7 04
4 Arkansas 2966369 7 05
5 California 38802500 7 06
6 Colorado 5355866 7 08
7 Connecticut 3596677 7 09
8 Delaware 935614 7 10
9 District of Columbia 658893 7 11
10 Florida 19893297 7 12
# ℹ 42 more rowsParsing the response can be the trickiest step. Here, the data of interest are rectangular and the JSON object is simple to parse. Sometimes, the returned object will be a complicated hierarchical structure, which will demand writing more R code.
Always read an API’s terms of service to ensure that use of the API conforms to the API’s rules.
Furthermore, it is a good idea to only run one API request at a time and to identify yourself as a user-agent in the header of the HTTP request. This is simple with user_agent() from library(httr):
Many other APIs have different authentication methods beyond simple API keys. Some use OAuth, bearer tokens, or other methods. The pattern shown above with .env files and Sys.getenv() works for most simple API key authentication.
Re-run load_dot_env() after creating or modifying the .env file to load the updated credentials.
A single API call could potentially return an unwieldy amount of information. This would be bad for the server, because the organization would need to pay for lots of computing power. This would also be bad for the client because the client could quickly become overwhelmed by data. To solve this issue, many APIs are paginated. Pagination is simply breaking API responses into subsets.
For example, the original example returned information for all states in the United States. When information is requested at the Census tract level, instead of returning information for the entire United States, information can only be requested one state at a time. Getting information for the entire United States will require iterating through each state.
Rate limiting is capping the number of requests by a client to an API in a given period of time. This is most relevant when results are paginated and iterating requests is necessary. It is also relevant when developing code to query an API–because a developer can burden the API with ultimately useless requests.
It is sometimes useful to add Sys.sleep() to R code, to pause the R code to give the API a break from requests between each request. Even 0.5 seconds can be the difference.
This example pulls information at the Census tract level. Because of pagination, the example requires a custom function and iterates that function using map_df() from library(purrr). It includes Sys.sleep() to pause the requests between each query.
The example pulls the estimated number of males (B01001_002E) and females (B01001_026E) in the 2018 5-year ACS for each Census tract in Alabama and Alaska.
Here are a few select columns for the 2018 5-year ACS from the Census API documentation page:
| Vintage | Dataset Name | Dataset Type | Geography List | Variable List | Group List | Examples |
|---|---|---|---|---|---|---|
| 2018 | acs>acs5 | Aggregate | geographies | variables | groups | examples |
This function 1. builds a URL and requests from the API, 2. checks for a server error, and 3. parses the response
get_tract_sex <- function(fips, census_key) {

  # build a URL
  url <- str_glue(
    "https://api.census.gov/data/2018/acs/acs5",
    "?get=B01001_002E,B01001_026E&for=tract:*&in=state:{fips}&key={census_key}"
  )

  # use the URL to make a request from the API
  acs_json <- GET(url = url)

  # check for a server error
  stop_for_status(acs_json)

  # get the contents of the response as a text string
  acs_json <- content(acs_json, as = "text")

  # create a character matrix from the JSON
  acs_matrix <- fromJSON(acs_json)

  # turn the body of the character matrix into a tibble
  acs_data <- as_tibble(acs_matrix[2:nrow(acs_matrix), ],
                        .name_repair = "minimal")

  # add variable names to the tibble
  names(acs_data) <- acs_matrix[1, ]

  # pause to be polite
  Sys.sleep(0.5)

  return(acs_data)

}This could be all states, districts, and territories. It’s only Alabama and Alaska for brevity.
map_df() iterates get_tract_sex() along the vector of state FIPS codes and returns a tibble.
# A tibble: 1,348 × 5
   B01001_002E B01001_026E state county tract
   <chr>       <chr>       <chr> <chr>  <chr>
 1 1657        1594        01    043    965401
 2 2180        2057        01    043    965402
 3 3166        1968        01    045    020000
 4 1530        1780        01    045    020801
 5 1952        2405        01    045    020802
 6 3123        3253        01    047    956100
 7 1223        1379        01    047    956201
 8 986         1055        01    047    956202
 9 1668        2081        01    047    956300
10 1322        1778        01    047    956400
# ℹ 1,338 more rowsThere are R packages that simplify interacting with many popular APIs. library(tidycensus) (tutorial here) and library(censusapi) (tutorial here) simplify navigating Census documentation, checking the status code, building URLs for the Census API, and parsing JSON responses. This can save a lot of time and effort! The following code is one iteration of the advanced example from above!
# A tibble: 1,181 × 5
   state county tract  B01001_002E B01001_026E
   <chr> <chr>  <chr>        <int>       <int>
 1 01    043    965401        1657        1594
 2 01    043    965402        2180        2057
 3 01    045    020000        3166        1968
 4 01    045    020801        1530        1780
 5 01    045    020802        1952        2405
 6 01    047    956100        3123        3253
 7 01    047    956201        1223        1379
 8 01    047    956202         986        1055
 9 01    047    956300        1668        2081
10 01    047    956400        1322        1778
# ℹ 1,171 more rowsR provides robust tools to call APIs. Many R packages, including some developed by data scientists at the Urban Institute, provide more user-friendly interfaces to APIs. Remember to be polite when calling APIs and not to share API credentials publicly.